In late 2023, Edward McQuarrie put out some brilliant research showing that whilst stocks typically have delivered higher returns than bonds, they don’t always.
The one question it didn’t answer however, is under what circumstances bonds are more likely to beat stocks, or is it just random? So I took 150 years of data across the G4 economies (U.S, UK, Germany, Japan) from the Macrohistory dataset, to try and answer this question.
The returns data consists of regional stock indices (e.g. USA = S&P 500) and long-term government bonds (e.g. UK = perpetuals and 15-20 year composite) and I have focused on yearly returns because not everyone has a 10 year + investment horizon.
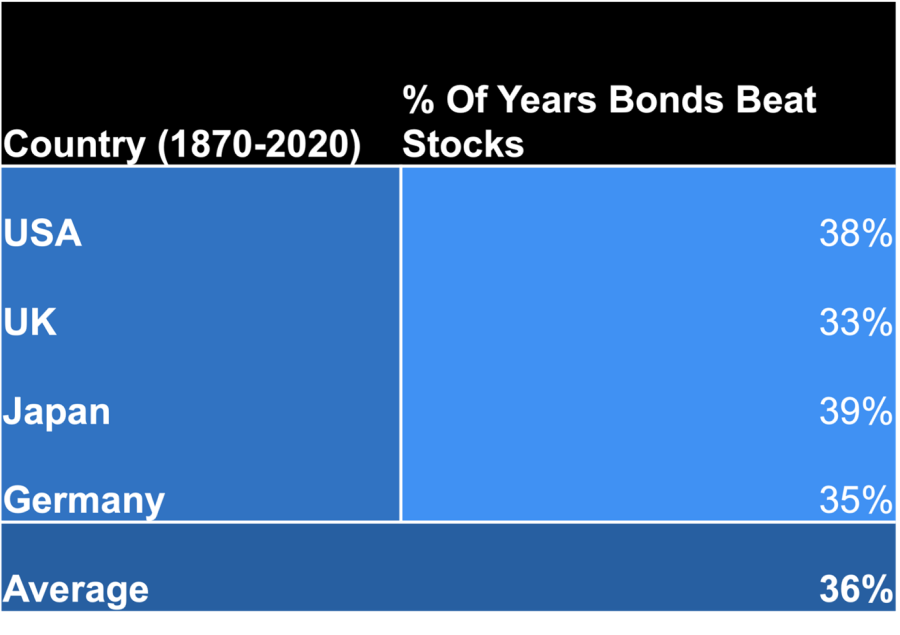
So to begin, how often do bonds beat stocks for these major economies? On average 36%, or about one in three years. So now we’ve got a baseline number, can we find circumstances where the odds change noticeably?

Source: Author's own calculations
When GDP is low
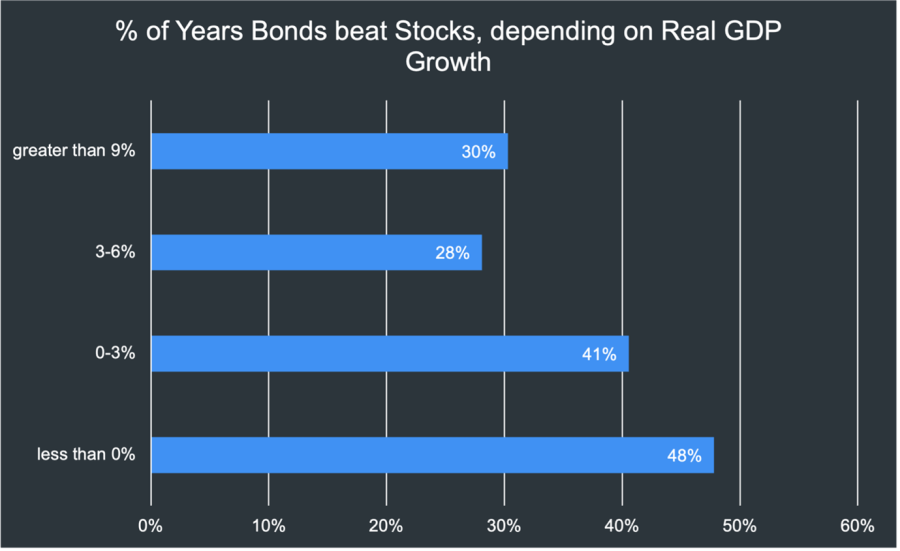
When we’re in a recession (years when GDP growth is less than 0%) you can see the percentage of years where bonds beat stocks goes to 48%, or almost one in two. That’s a 12% increase from our baseline.

Source: Author's own calculations
Whereas when we have high growth (3% or more), then stocks have a clear advantage. You could argue forecasting a recession is difficult, however with advances in real-time data you can get better estimates than a few years ago.
When yield curves are inverted
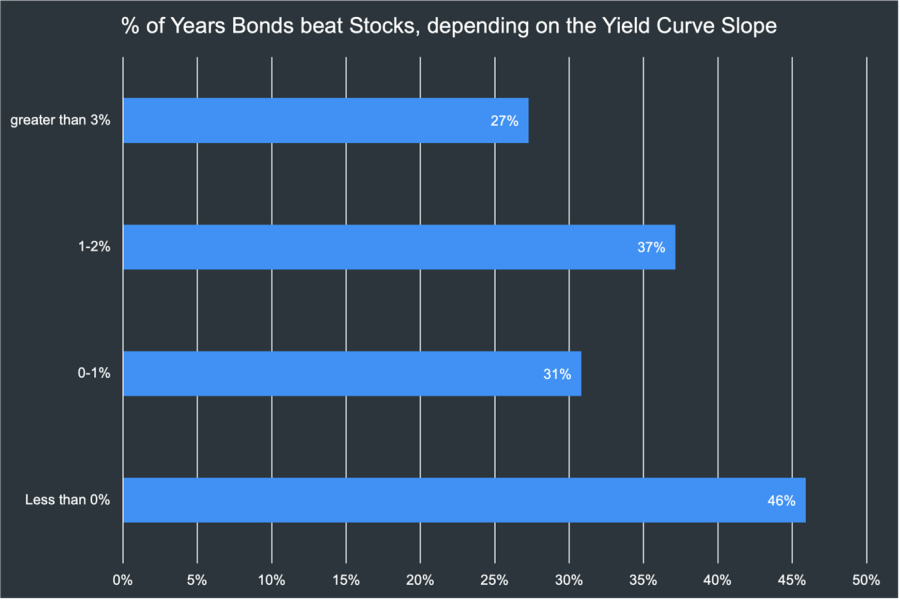
When you have an inverted yield curve at the start of the year (e.g. when a three month treasury bill yields more than a 10 year government bond), the percentage of times bonds beat stocks increases to 46% (again almost one in two), 10% higher than our baseline.

Source: Author's own calculations
Yield curves inversions often happen before recessions, so you could argue that this indicator and real GDP are looking at the same thing. However, GDP is an economic indicator and the yield curve is a financial market indicator.
Therefore by using both together, you’re able to combine economic fundamentals and market pricing, which should lead to better decision making overall.
When outright yields are high
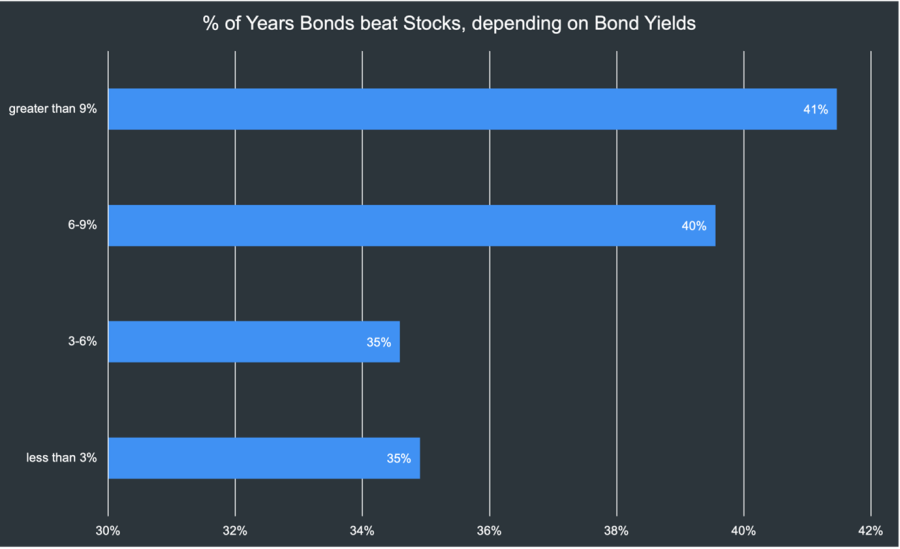
Surprisingly, this is actually the least useful of the three. When yields on long-term bonds are north of 6% (which hasn’t happened in more than two decades in the G4 countries).

Source: Author's own calculations
The percentage of years bonds beat stocks goes to 40%, or four in 10 years, 4% higher than our baseline.
Conclusion
In summary, government bonds have a better chance of beating stocks when: there is low or negative real GDP growth; the yield curve is negative/inverted; and when bond yields are more than 6%.
That said, none of the three indicators covered ever produced greater than 50% odds of bonds beating stocks. Therefore, small 5-10% changes in asset allocation to bonds/stocks accordingly, seems more logical than completely abandoning one asset class for another.
Chris Barter is a manager in the investment office at Scottish Widows. The views expressed above are the author's own, not those of Scottish Widows and should not be taken as investment advice.


