.

“There are no new eras – excesses are never permanent.”
The above sentiment is found in the Market Rules to Remember, a list of 10 cautionary guidelines written by former Merrill Lynch chief market analyst Bob Farrell.
It reminds investors that there might be a hot group of stocks that dominate the market for a few years but this can change rapidly and today’s winners become tomorrow’s losers.
With this in mind, Bank of America’s strategists have reviewed the past century to look at which assets rose and fell across each decade.
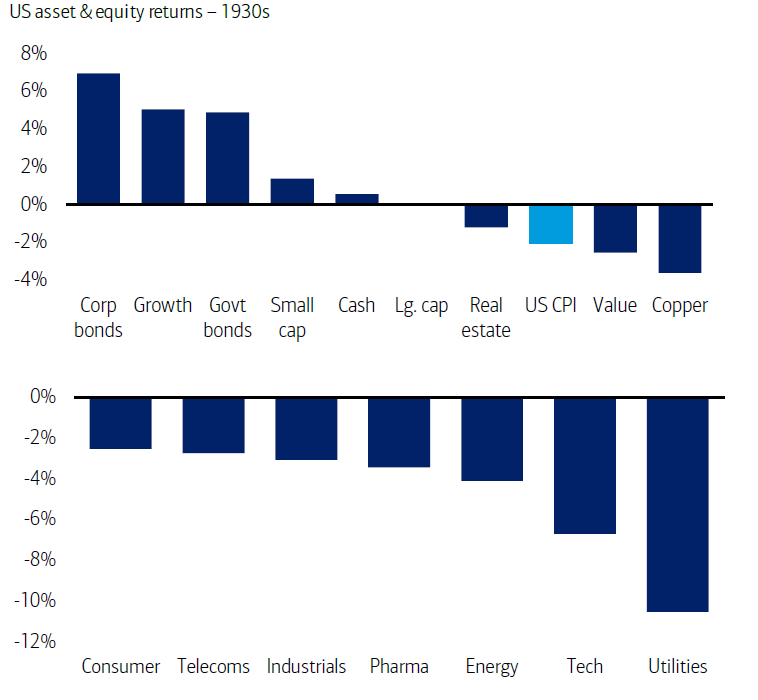
1930s: Economic depression and deflation
The 1930s were a turbulent decade for investors, as the world faced the aftermath of the Great Crash of 1929 and the onset of the Great Depression. Stock markets plummeted at its start, wiping out the wealth of many speculators and triggering bank failures and mass unemployment.
Bank of America noted: “The 1930s was a decade of economic depression and deflation, the Smoot-Hawley Tariff Act, Britain abandoning the gold standard, Glass-Steagall, widespread debt defaults, the New Deal and the beginning of World War II.”
Because of this, annual GDP growth in the US averaged -0.2% while inflation averaged -2%.
Against this backdrop, the winners were bonds (both corporate and sovereign) and growth stocks while the losing assets were commodities, value stocks, real estate and utilities.
Source: BofA Global Investment Strategy, Bloomberg, Ibbotson, Fama-French growth/value series, Case-Shiller, Bureau of Economic Analysis, Homer & Sylla, A History of Interest Rates
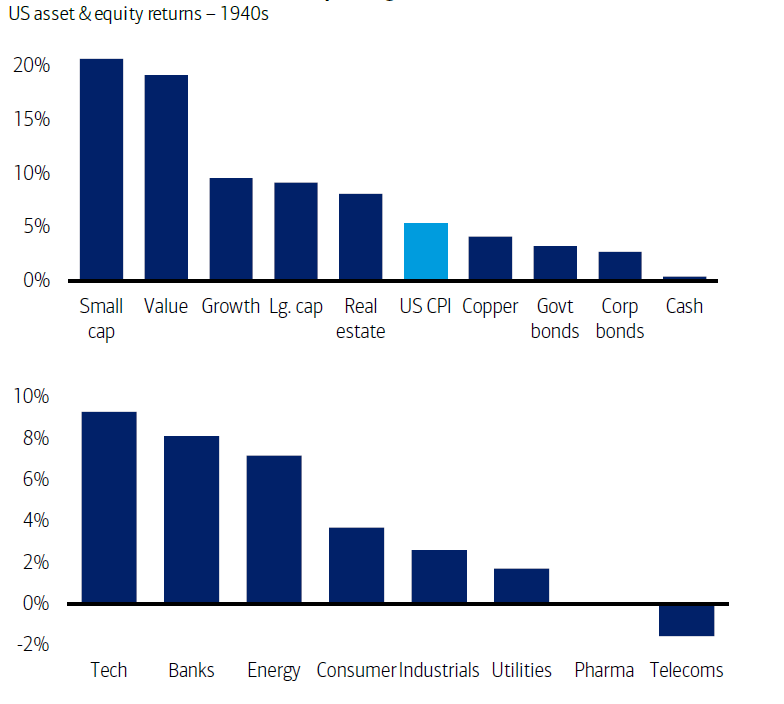
1940s: War and defence spending
Bank of America noted that the 1940s was the decade of “World War II, substantial defence spending, Pearl Harbor, atomic bombs, the Marshall Plan, nationalisation and restoration of collective bargaining and the beginning of the Cold War”.
This led to a surge in nominal economic growth, with annual US GDP growth averaging 11.7% and inflation jumping to a rate of 5.4% per annum.
Equities, especially small-cap, value and tech stocks, emerged as the investment winners of the 1940s; the losers were cash, bonds and telecom stocks.
Source: BofA Global Investment Strategy, Bloomberg, Ibbotson, Fama-French growth/value series, Case-Shiller, Bureau of Economic Analysis, Homer & Sylla, A History of Interest Rates
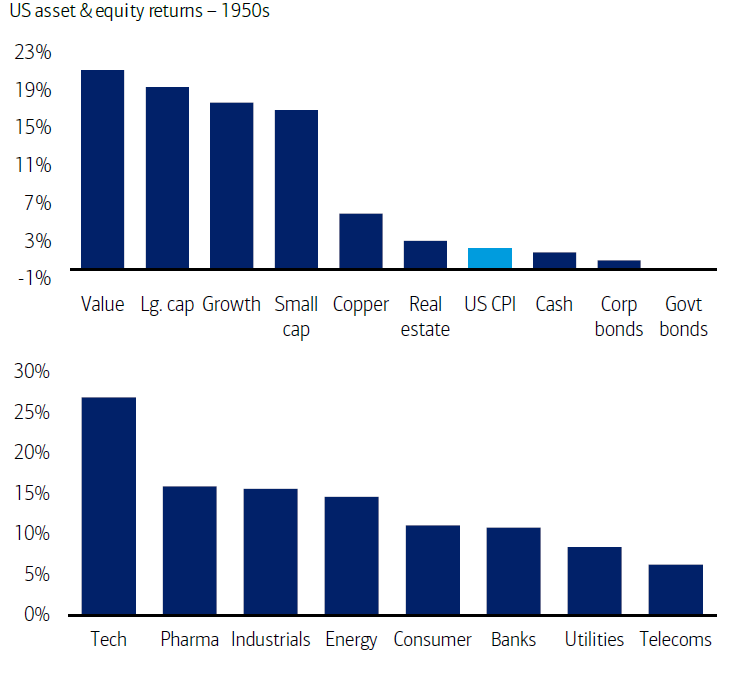
1950s: Economic recovery and lower inflation
Among the main events of the 1950s were the Korean War, the Warsaw Pact, the formation of the European Economic Community (EEC) and the economic recovery of Europe following the devastation of World War 2.
“There was a very favourable economic climate with strong average annual US GDP growth of 6.7% and much lower inflation of 2.2% per annum,” Bank of America’s strategists said.
The best-performing assets of the 1950s were equities, especially large-cap, value and tech stocks and copper, while cash, bonds and bond-proxy stocks were the worst.
Source: BofA Global Investment Strategy, Bloomberg, Ibbotson, Fama-French growth/value series, Case-Shiller, Bureau of Economic Analysis, Homer & Sylla, A History of Interest Rates
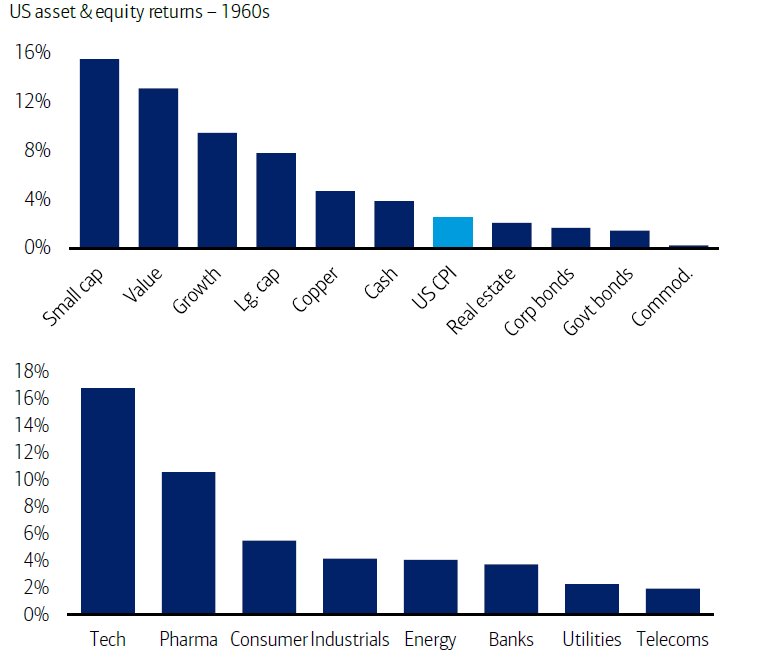
1960s: US pre-eminence to dissent and instability
Summing up the 1960s, Bank of America said it was a decade that began with “US political and economic pre-eminence and ended with the ‘American Century’ unravelling with Vietnam, social dissent and monetary instability”.
Conditions on the economic front were mixed: annual US GDP growth averaged a strong 6.9% and inflation averaged a low 2.5% but a dangerous inflationary spiral emerged from 1965 onward.
Equities – small-cap, value and tech stocks in particular – made the best returns in the 1960s with commodities, bonds, bond-like stocks and real estate lagging behind.
Source: BofA Global Investment Strategy, Bloomberg, Ibbotson, Fama-French growth/value series, Case-Shiller, Bureau of Economic Analysis, Homer & Sylla, A History of Interest Rates
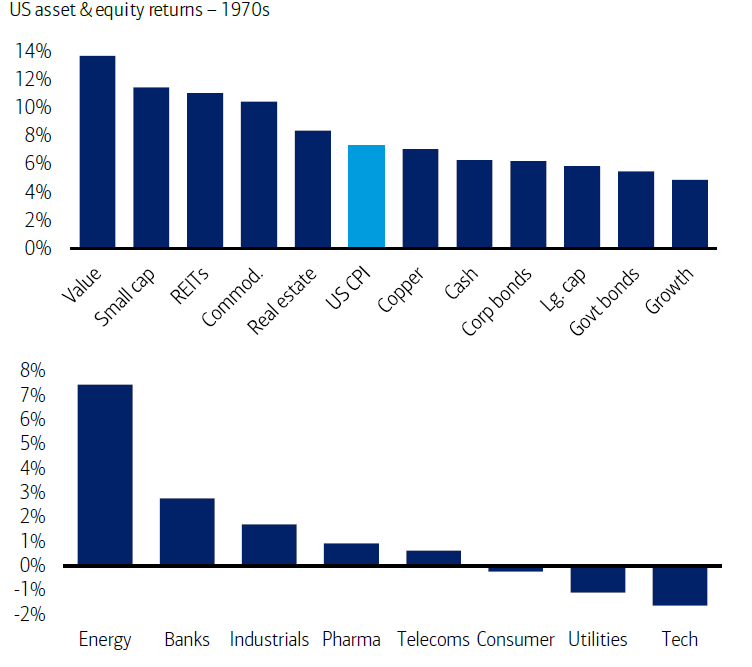
1970s: Great inflation
The inflationary spiral that started in the previous decade came to a head in the 1970s. US inflation averaged 7.4% over the period, with average annual US GDP growth standing at 10.1%.
Alongside “great and protracted inflation”, the 1970s featured monetary instability, large budget and trade deficits, wage and price controls, OPEC-induced spikes in oil prices, Watergate and the Soviet invasion of Afghanistan.
In this environment, small-cap, value & energy stocks, commodities and real estate performed the best. The losers were large-cap, growth, tech and utilities stocks.
Source: BofA Global Investment Strategy, Bloomberg, Ibbotson, Fama-French growth/value series, Case-Shiller, Bureau of Economic Analysis, Homer & Sylla, A History of Interest Rates
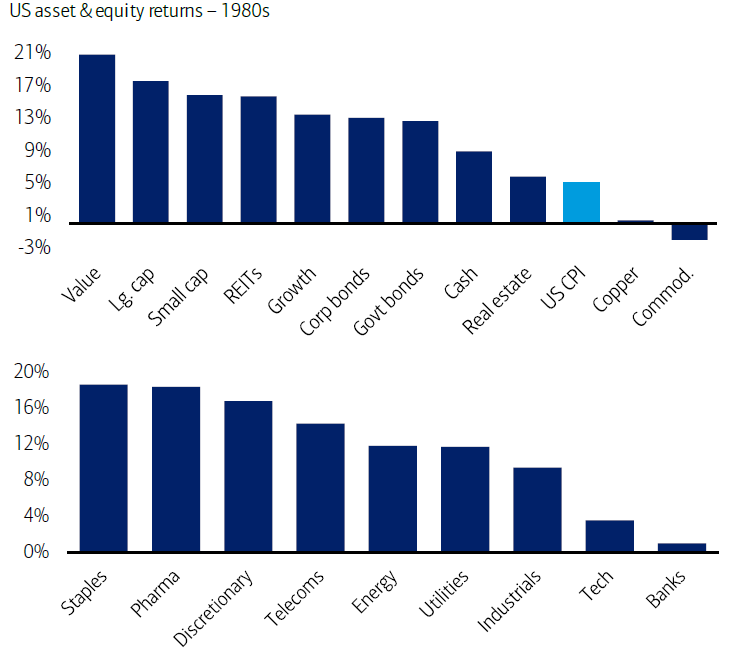
1980s: Peak in inflation to economic expansion
“The decade started with a second oil shock and the LatAm debt crisis, ended with the savings and loan crisis, Black Monday, the fall of the Berlin Wall and an asset bubble in Japan,” Bank of America explained.
“But critically, the 1980s saw a major peak in global inflation and interest rates and thereafter a sustained economic expansion.”
Annual US GDP growth ran at an average of 7.9% in this decade and an era of disinflation began with inflation rates declining sharply to average 5.1%.
The winning investments were equities (especially large-caps, value stocks, staples and pharma), real estate investment trusts (REITS) and bonds. Commodities, bank and tech stocks were the places to avoid.
Source: BofA Global Investment Strategy, Bloomberg, Ibbotson, Fama-French growth/value series, Case-Shiller, Bureau of Economic Analysis, Homer & Sylla, A History of Interest Rates
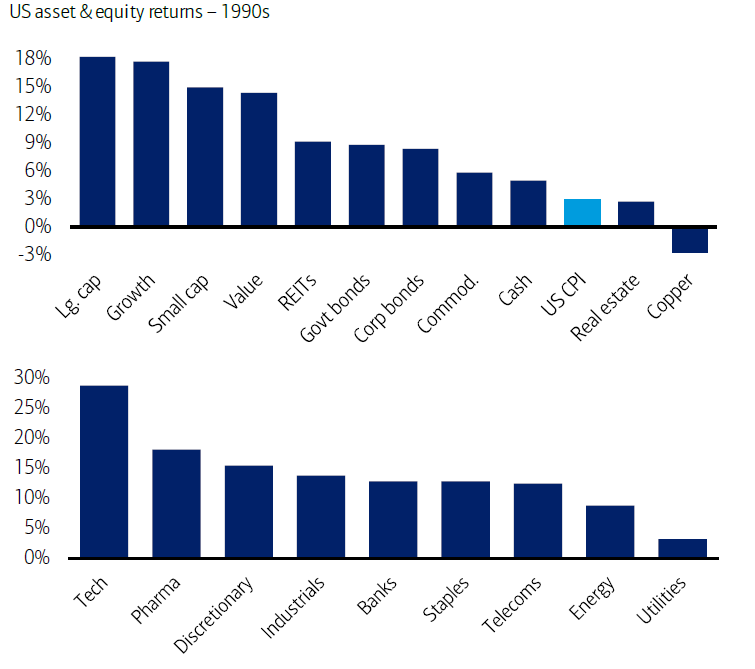
1990s: Bubble introduction
Balanced budgets from global governments, the introduction of the euro and the signing of the Maastricht Treaty, NAFTA, (North America Free Trade Agreement) and Uruguay Round of GATT (General Agreement on Tariffs and Trade) were the key themes of the 1990s.
But the negatives of the decade included the bursting of the Japanese asset bubble and the Tequila and Asian financial crises. Meanwhile, the tech bubble was inflating.
Annual US GDP growth averaged a “healthy” 5.5% and inflation was “low and stable” 2.9%.
Investment winners were equities, especially large-cap, growth, tech and pharma stocks, REITS and bonds. Property, commodities, utilities and energy stocks were the losers.
Source: BofA Global Investment Strategy, Bloomberg, Ibbotson, Fama-French growth/value series, Case-Shiller, Bureau of Economic Analysis, Homer & Sylla, A History of Interest Rates
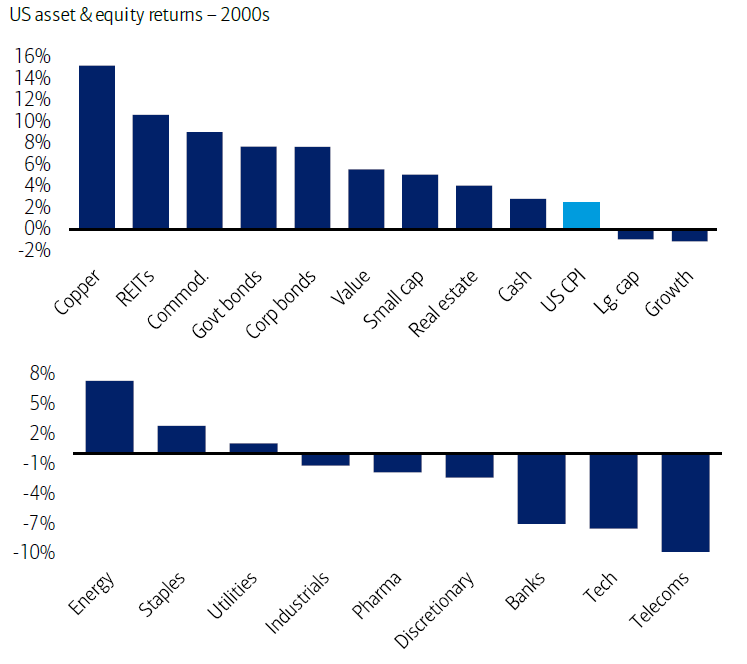
2000s: Bubble bursts
The negatives come thick and fast in the new millennium: Bank of America highlighted the bursting of the tech bubble, the 9/11 terrorist attacks, wars in Afghanistan and Iraq, China’s equity market bubble and bust, the subprime mortgage crisis and the global financial crisis.
“US GDP growth averaged 4.1%, the weakest since the 1930s, and inflation declined, averaging 2.5% (CPI turned negative in 2009),” its strategists added.
Copper, REITS, bonds, commodities and energy stocks made the highest returns in the 2000s while the lowest came from stocks, in particular large-caps, growth, tech and telecoms.
Source: BofA Global Investment Strategy, Bloomberg, Ibbotson, Fama-French growth/value series, Case-Shiller, Bureau of Economic Analysis, Homer & Sylla, A History of Interest Rates
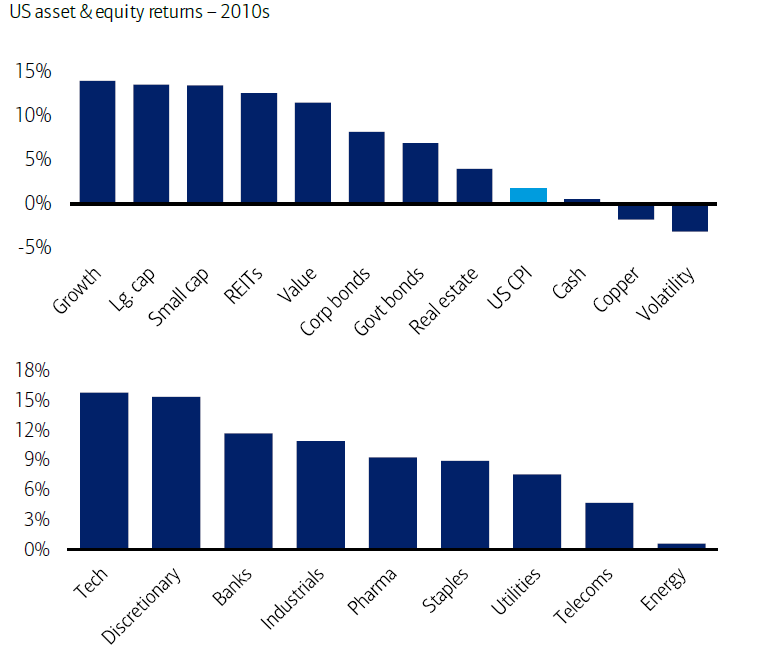
2010s: Strong returns across most asset classes
Bank of America described the 2010s as the decade of “unfettered, revolutionary monetary policies”, pointing to quantitative easing, zero interest rate policy, negative interest rate policy and yield curve control.
Other characteristics of the past decade were European debt crises and setbacks to globalisation, in the form of Brexit, the failure to ratify the Trans-Pacific Partnership and the Trump presidency.
That said, the bank’s strategists added: “The 2010s was a period of very strong returns for most asset classes. With the notable exception of commodities, assets have been ‘inflated’ by central bank quantitative easing and zero/negative rate policies.”
Equities did well in the 2010s, with small- and large-cap stocks, growth stocks, technology, discretionary and banking making the best returns. Cash, commodities, copper and energy struggled.
Source: BofA Global Investment Strategy, Bloomberg, Ibbotson, Fama-French growth/value series, Case-Shiller, Bureau of Economic Analysis, Homer & Sylla, A History of Interest Rates
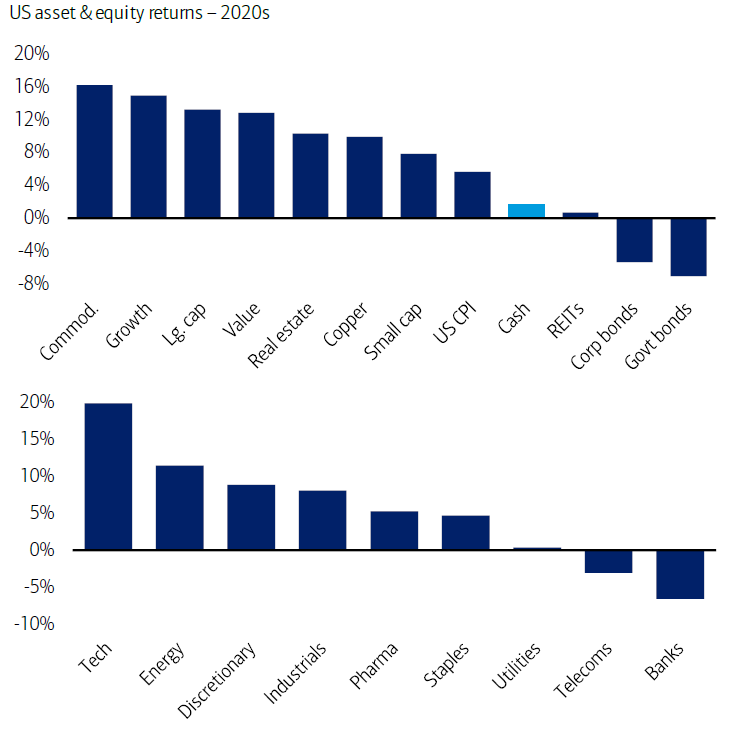
2020s: An era of higher interest rates and volatility
We might only be almost four years in the 2020s, but they have been eventful ones. Bank of America expects many investment drivers to be turned on their head over the coming years, as covered in a recent Trustnet article.
The bank predicts the 2020s will be “a decade of pandemic, wars, fiscal excess, the end of [quantitative easing], the return of inflation and a historic outperformance of commodities versus government bonds.”
So far, the winners of this decade have been commodities, growth stocks, large-cap, technology and energy with bond, banks and REITs being the losers.
Source: BofA Global Investment Strategy, Bloomberg, Ibbotson, Fama-French growth/value series, Case-Shiller, Bureau of Economic Analysis, Homer & Sylla, A History of Interest Rates


